

In healthcare, ATU (Awareness, Trial, and Usage) studies play a key role in understanding how healthcare providers (HCPs) and patients see, try, and use different treatments or products. Power BI and Tableau make it easy to analyze and share data from these studies by transforming numbers and survey results into visual dashboards. This move from traditional, static reports to interactive, dynamic visualizations is highly beneficial, offering a range of clear advantages.
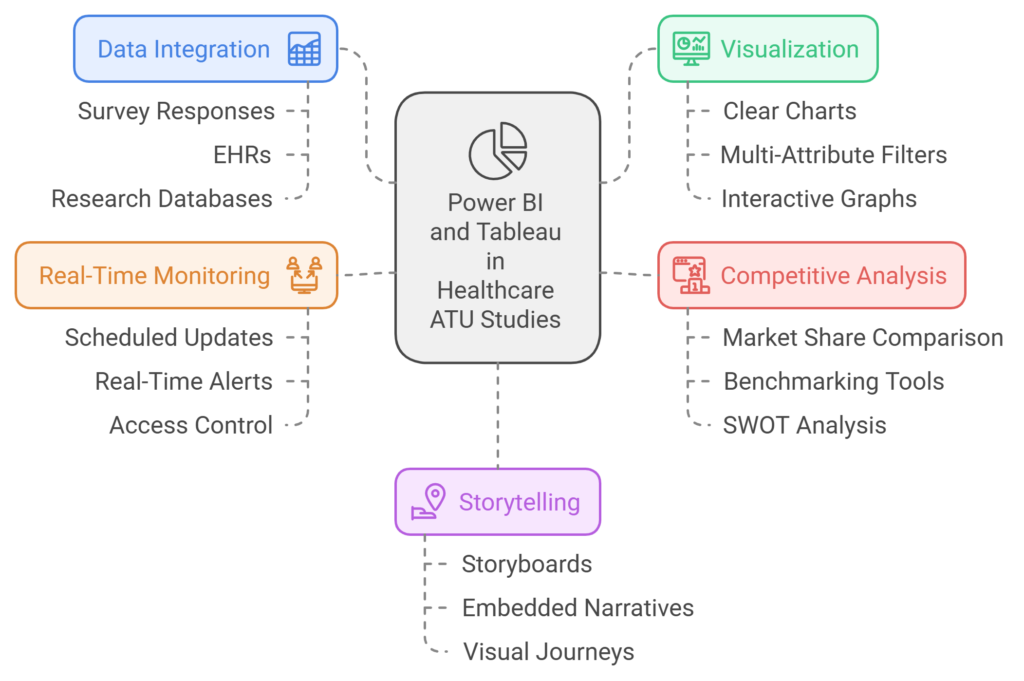
The first benefit is how easily these platforms combine data from many sources. ATU studies often include survey responses, electronic health records (EHRs), and information from different research databases. Power BI and Tableau connect seamlessly to these varied sources, putting all the data in one place for analysis. This integration gives healthcare teams a full picture of brand awareness, trial rates, and usage patterns across different regions and patient groups. The time saved on manual data merging allows teams to dive straight into insights. With more accurate data, they can focus on finding patterns and trends rather than getting bogged down by data preparation.
Power BI and Tableau also make complex data easier to understand by transforming it into clear visuals. Instead of sifting through numbers, users can view metrics on brand awareness, trial rates, and usage patterns in simple charts. Features like multi-attribute filters let users look at specific groups, like certain age brackets or geographic areas. Interactive charts and graphs allow users to explore data from different angles. For example, clicking on a chart showing brand awareness can instantly filter related data on trial rates. This visual approach helps identify where people are dropping out of the adoption process, which is valuable for improving marketing and educational efforts.
When it comes to competition, Power BI and Tableau provide tools for comparing performance with other brands. For example, teams can view dashboards that show each competitor’s market share at each stage of the ATU funnel. Benchmarking tools offer easy side-by-side comparisons, helping teams understand strengths and weaknesses. With clear visuals like bar graphs and SWOT analysis, healthcare companies can see where they stand and make informed decisions on how to gain ground against competitors.
Power BI and Tableau also make it possible to track patient usage and adherence patterns. This is especially helpful for treatments that require consistent use for good outcomes. With features like time-trend analysis and usage cohorts, healthcare teams can monitor how often a product is used and see if there are any drop-offs in adherence. Identifying these trends lets organizations step in with support programs or educational materials to help patients stay on track, ultimately improving patient outcomes.
Another key benefit is the real-time monitoring and easy sharing of dashboards. Power BI and Tableau let users schedule updates, set up real-time alerts, and control who can access specific data. This ensures that teams across the organization always have the latest information. For example, the marketing team can see up-to-date awareness metrics, while R&D might focus on usage data. Real-time access allows quick responses to shifts in awareness, trial uptake, or usage, helping companies stay competitive.
Beyond the numbers, Power BI and Tableau help teams tell a clear story with the data. With features like storyboards and embedded narratives, these platforms guide users through ATU findings in a step-by-step format. This storytelling approach makes data accessible to non-technical team members, from marketing to executive leadership. Instead of presenting rows of data, teams can show visual journeys through the ATU process, making it easier to understand the brand’s position and performance.
In summary, Power BI and Tableau offer a complete toolset to enhance ATU studies in healthcare. By combining data integration, engaging visualizations, competitive analysis, real-time updates, and storytelling, these platforms bring ATU data to life. Healthcare companies gain deeper insights into how their products are perceived and used. They can act on these insights faster, improving both patient outcomes and their competitive edge. With Power BI and Tableau, ATU studies become a powerful driver of strategy, giving healthcare brands the information they need to succeed in a fast-changing market.