

Dashboard Features 1. Segment Analysis The Segment Analysis tab allows users to break down employee attrition data by various parameters, such as department, job role, salary slab, tenure, gender, age group, education, and marital status. Users can drill into individual departments to see which teams experience the highest turnover. Cross-filtering functionality ensures users can select […]
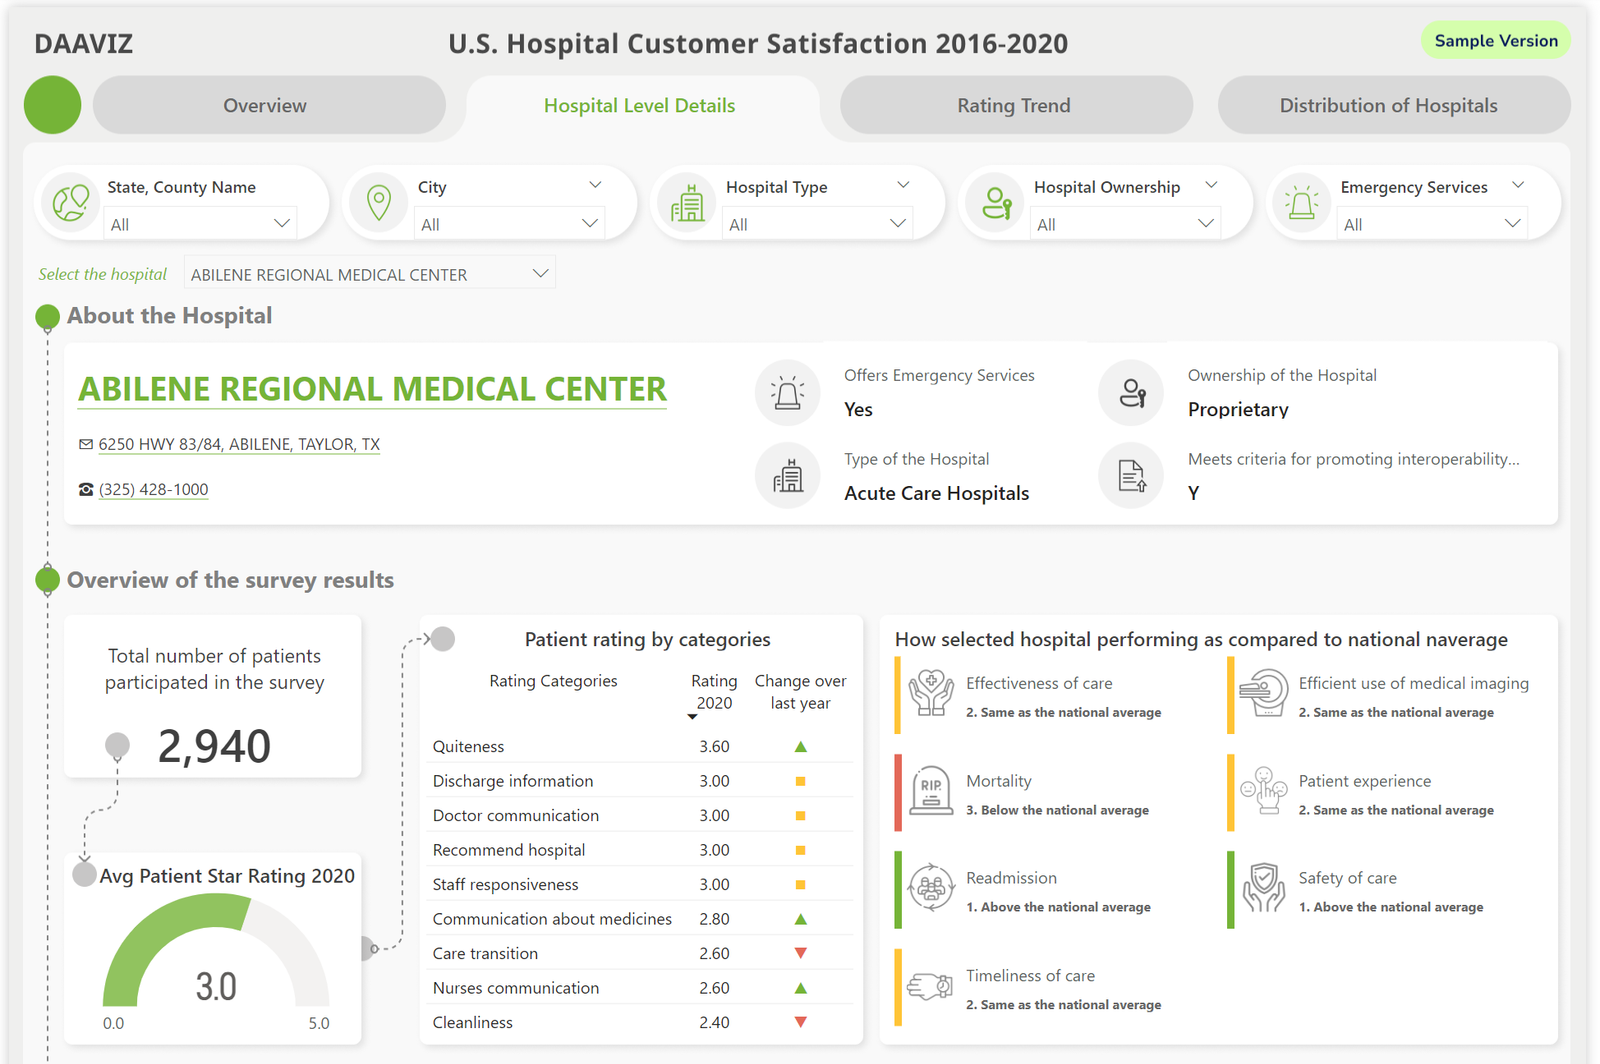
This interactive Power BI dashboard empowers users to explore patient satisfaction and hospital quality metrics across the U.S. healthcare landscape. Leveraging data from the Centers for Medicare & Medicaid Services (CMS) Hospital Compare website, the dashboard provides insights into a variety of areas.

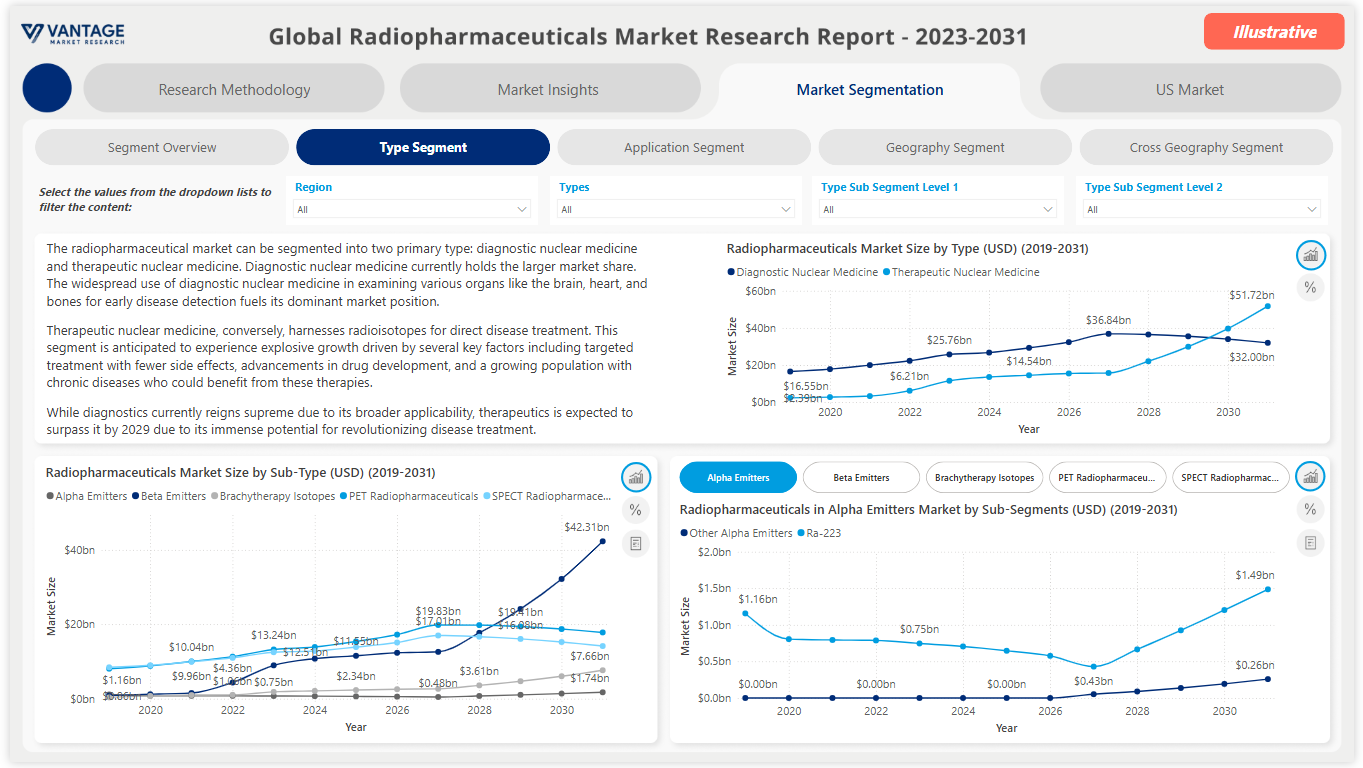
Embark on a journey of data-driven insights with our captivating Power BI dashboard, meticulously crafted to showcase the depth of our analytics expertise. This sample dashboard encapsulates a fusion of data visualization prowess and business acumen, offering a glimpse into the transformative power of Power BI.
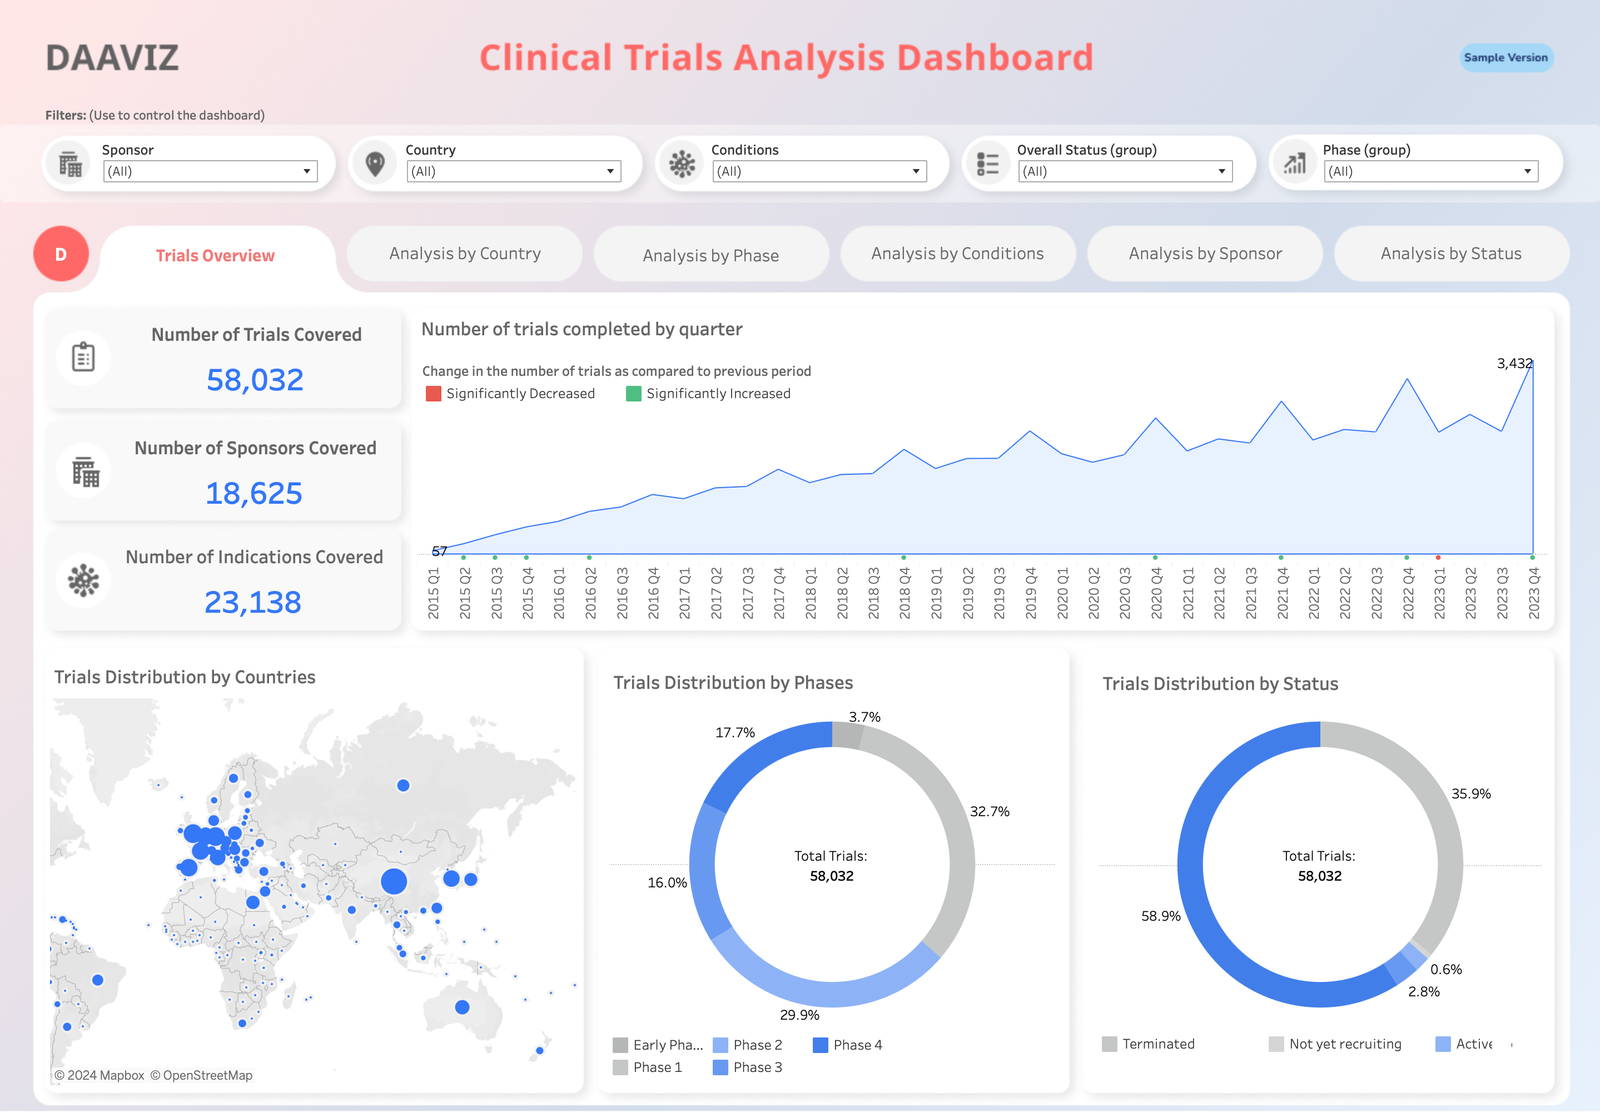
Discover the power of data visualization in healthcare with our sample Tableau dashboard focusing on clinical trials analysis. This interactive dashboard allows you to delve into vital insights based on various criteria such as country, trial status, phase, and indication.