Unveiling Patient Satisfaction and Hospital Quality Trends (Power BI Dashboard)
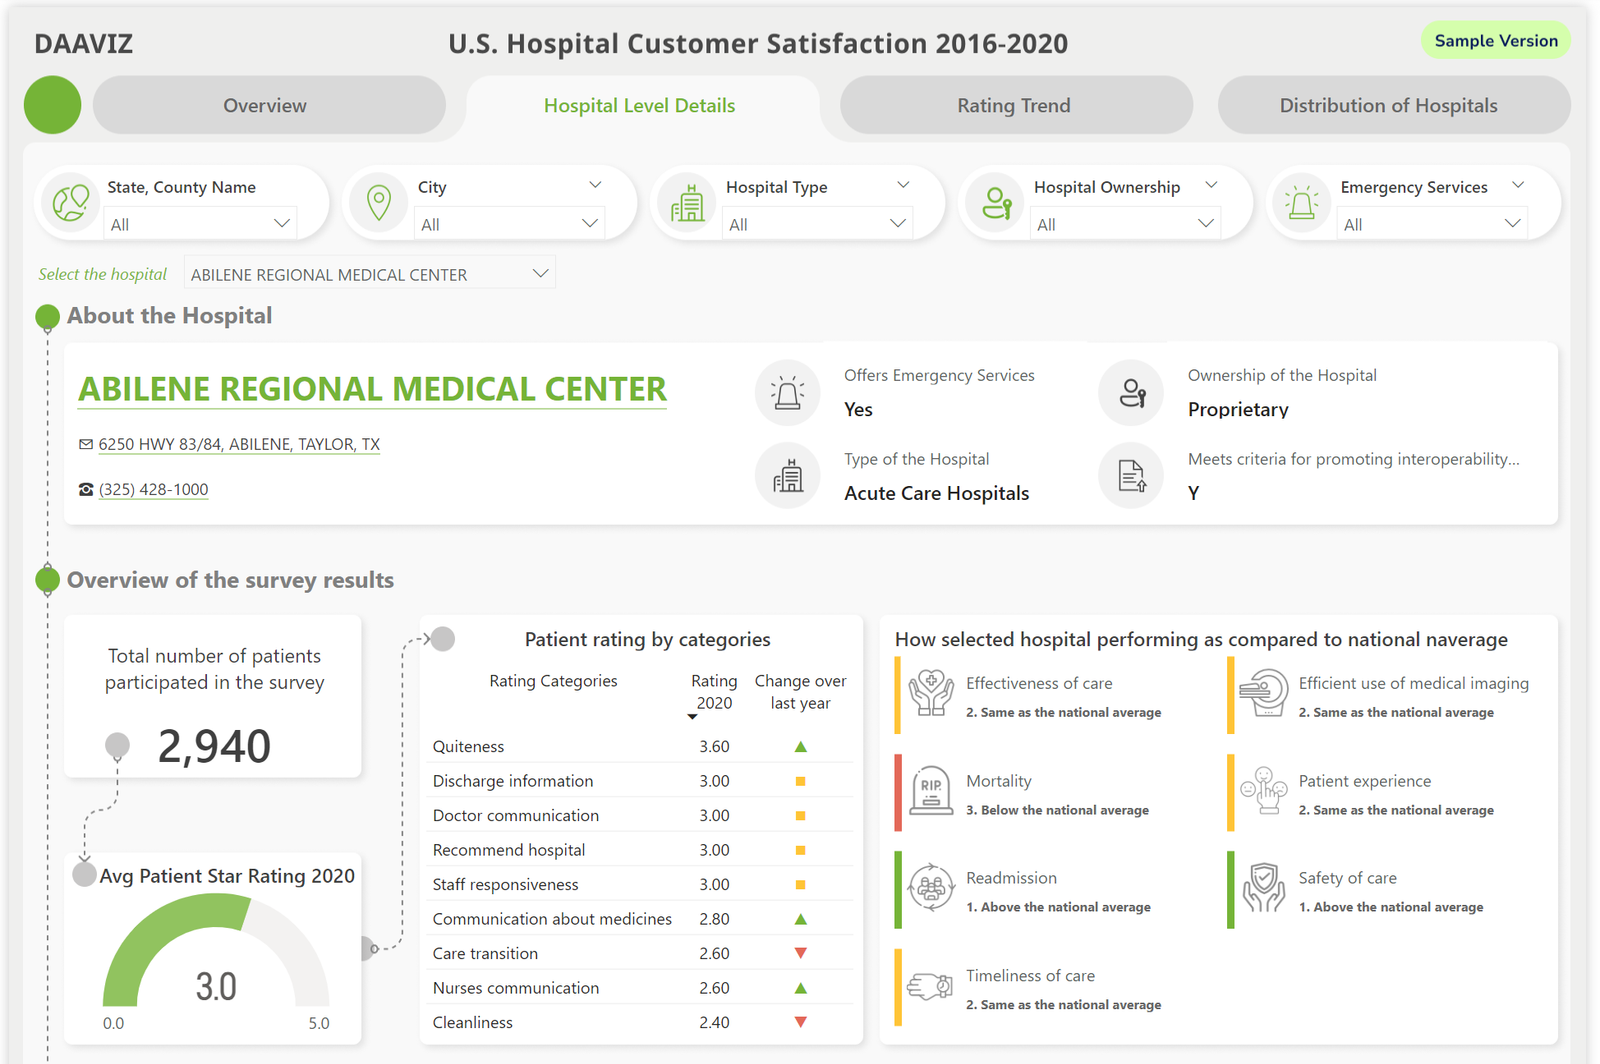
This interactive Power BI dashboard empowers users to explore patient satisfaction and hospital quality metrics across the U.S. healthcare landscape. Leveraging data from the Centers for Medicare & Medicaid Services (CMS) Hospital Compare website, the dashboard provides insights into a variety of areas, including:
- National Patient Satisfaction: Gauge overall patient experience with U.S. hospitals through HCAHPS survey scores. Analyze trends and identify potential regional variations.
- Hospital Performance Comparison: Compare hospitals based on various quality measures, including mortality rates, safety of care, readmission rates, and efficiency. Identify top performers across different hospital types (e.g., public, private, children’s).
- Drilling Down: Explore details for specific hospitals, examining their patient experience scores alongside national benchmarks.
Key Features:
- Interactive Filters: Refine your analysis by filtering data based on hospital type, location, and specific quality measures.
- Visualizations: Utilize clear and informative charts and graphs to understand trends and compare performance metrics.
- Data Export: Easily export relevant data sets for further analysis.
Benefits:
- Informed Healthcare Decisions: Gain valuable insights to make informed choices about hospital selection.
- Benchmarking and Performance Analysis: Healthcare providers and policymakers can leverage the data to benchmark performance and identify areas for improvement.
- Transparency in Healthcare: The dashboard promotes transparency in patient care by providing readily accessible data on hospital quality.
This Power BI dashboard is a valuable tool for anyone interested in understanding patient experience and hospital quality in the U.S. healthcare system.
OUR PROJECTS
Recent Portfolio

Tableau Clinical Trials Sample Dashboard
Tableau Dashboards

Experience Data Brilliance: Sample Power BI Dashboard Showcase
Power B Dashboards

Enhanced Healthcare Customer Segmentation Analysis by DAAVIZ
Data Analytics

Unlocking Employee Retention: An Interactive Attrition Dashboard
Power B Dashboards

The Market Research Dashboard Reimagined (Data to Decision)
Power B Dashboards

Enhanced Healthcare Customer Segmentation Analysis by DAAVIZ
Data Analytics

Tableau Clinical Trials Sample Dashboard
Tableau Dashboards

Experience Data Brilliance: Sample Power BI Dashboard Showcase
Power B Dashboards

Unlocking Employee Retention: An Interactive Attrition Dashboard
Power B Dashboards

The Market Research Dashboard Reimagined (Data to Decision)
Power B Dashboards

Enhanced Healthcare Customer Segmentation Analysis by DAAVIZ
Data Analytics

Experience Data Brilliance: Sample Power BI Dashboard Showcase
Power B Dashboards

Unlocking Employee Retention: An Interactive Attrition Dashboard
Power B Dashboards

The Market Research Dashboard Reimagined (Data to Decision)
Power B Dashboards

Tableau Clinical Trials Sample Dashboard
Tableau Dashboards


